
How to compare thermal profiles for reflow process benchmarking
DETAILS
How to compare thermal profiles for reflow process benchmarking
Two reflow ovens can deliver similar peak temperatures yet produce different soldering outcomes. One assembly may heat uniformly, while another reaches the same peak only after exposing smaller components to excessive thermal stress. For meaningful reflow process benchmarking, the comparison must cover the full thermal profile—not just the hottest reading or the oven recipe.
Ramp rate, soak behavior, time above liquidus, cooling rate, and temperature variation across the assembly all matter. So do the test conditions behind those measurements. A defensible comparison separates equipment capability from board design, measurement error, and recipe tuning. That distinction becomes especially important when qualifying EMS suppliers whose production lines use different oven architectures.
Decide what the benchmark is supposed to prove
There are two useful comparisons, and they answer different questions.
A controlled equipment comparison uses the same instrumented assembly, loading conditions, and measurement method to examine how different ovens deliver a defined thermal process. Each oven may need its own recipe; identical zone setpoints do not create identical heat transfer across machines with different heated lengths, convection systems, and zone arrangements.
A production-process comparison asks whether each supplier can repeatedly manufacture the intended assembly within its approved process window at the required throughput. Here, recipe development, line loading, maintenance condition, and operating discipline are part of the result—not distractions to remove.
State which question you are answering before collecting data. Otherwise, an oven running slowly with generous thermal margin may appear superior to a production line meeting a much higher output requirement. Neither result is useful without the throughput constraint.
Build the acceptance window from the assembly, not a generic recipe
Start with the solder paste supplier’s current technical data sheet, then reconcile it with component temperature limits, PCB material constraints, and any customer-approved process requirements. The usable window is the overlap between those requirements. If they do not overlap, recipe optimization alone may not solve the problem.
Do not assume every lead-free alloy has the same liquidus temperature. Define the threshold from the actual alloy specification. Likewise, distinguish a component’s package-body temperature limit from the temperature needed at its solder joints: those are different measurement locations serving different purposes.
IPC-7530 provides guidance on temperature profiling for mass soldering processes. IPC/JEDEC J-STD-020 addresses moisture/reflow sensitivity classification for applicable surface-mount devices; its classification profiles should not be treated as universal production recipes. Use the applicable revisions and component documentation when establishing limits.
IPC Class 3 acceptance requirements and ISO 9001 certification also do not establish a board-specific thermal window. They may belong in supplier qualification, but neither substitutes for measured process evidence.
Make the measurement setup transferable
The profiling board should represent the assembly’s thermal difficulty, not merely be convenient to instrument. Copper distribution, board thickness, component mass, shields, pallets, and panel configuration influence heating. A lightly populated coupon cannot establish capability for a dense assembly with substantial copper planes.
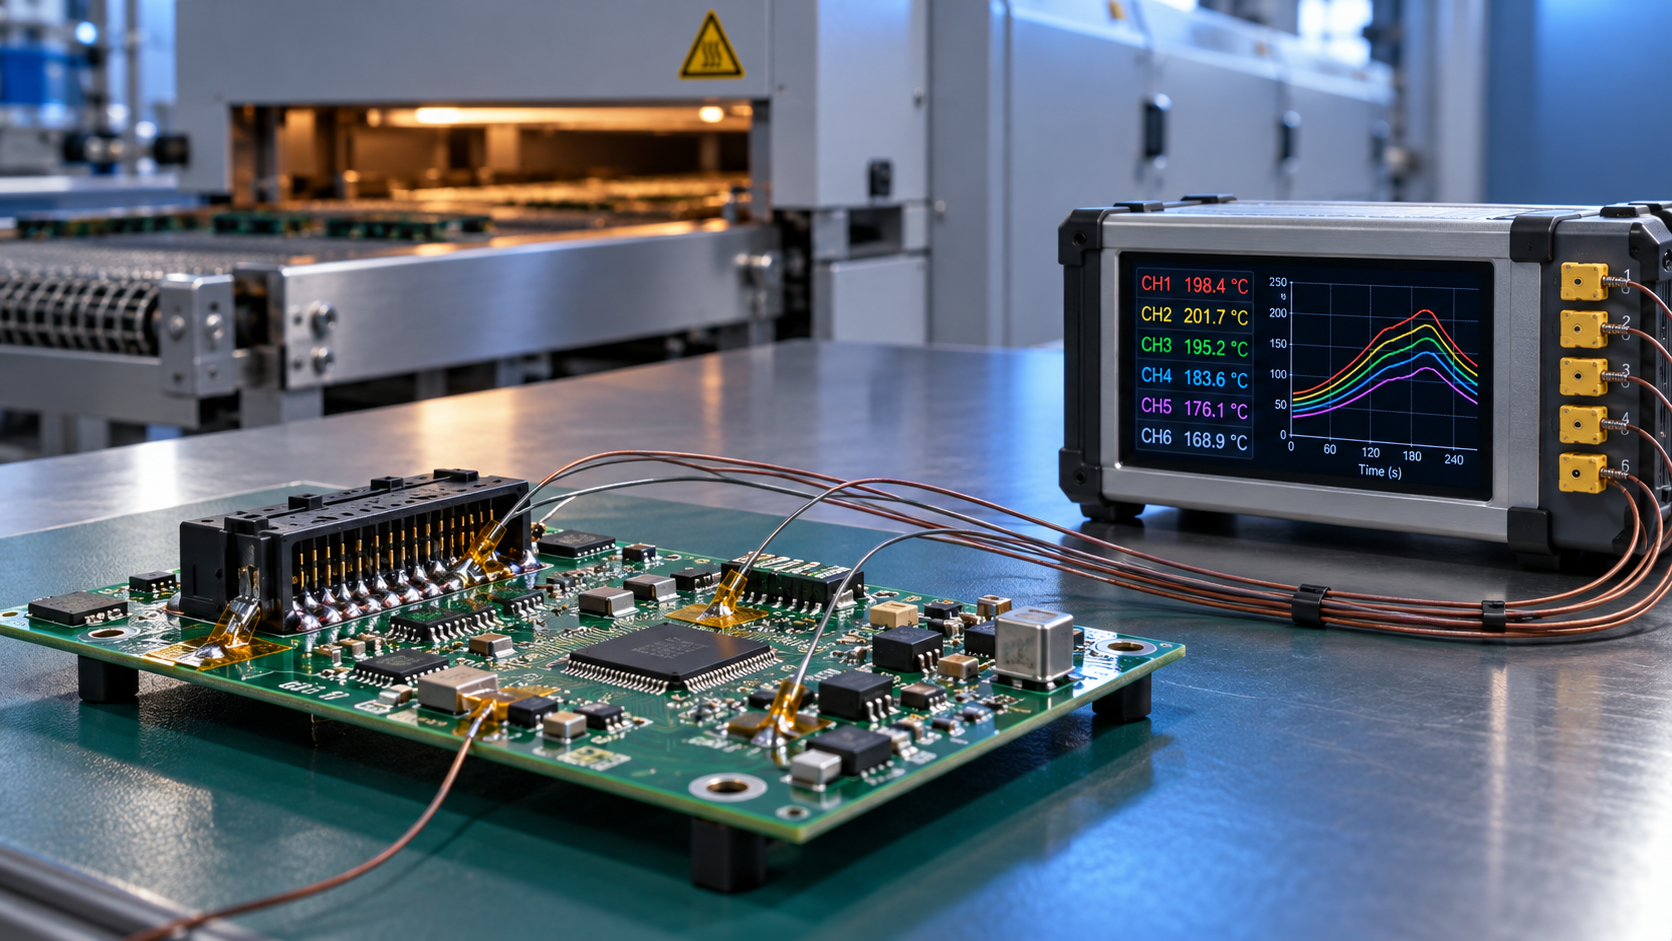
Place thermocouples where competing constraints are likely to appear: a thermally demanding joint, a low-mass component that heats quickly, a temperature-sensitive package body, and locations that reveal leading-edge, trailing-edge, or cross-board variation. For area-array packages, accessing a representative joint may require a dedicated profiling assembly and a documented attachment method.
A thermocouple sitting on top of a BGA package does not directly measure its solder-joint temperature. That distinction should remain visible in the report, rather than disappear behind a channel label such as “BGA.”
- Record thermocouple type, wire gauge, attachment material, and exact sensing location, supported by photographs.
- Verify logger calibration status and the integrity of the complete measurement chain, including connectors and thermocouple wire.
- Keep sampling interval, filtering, and calculation settings consistent across comparisons.
- Fix board orientation, conveyor position, rail support, carrier configuration, and profiler barrier placement.
- Document atmosphere, loading pattern, conveyor speed, and the oven’s stabilization condition.
Repeated thermal cycling can change the profiling assembly or loosen a sensor attachment. Inspect it between runs and define when it must be repaired or replaced. A drifting thermocouple should not become a supplier-performance trend.
Read the curves together, then examine each constraint
Overlay the temperature traces using a common time reference, normally oven entry. Preserve the actual process duration. Aligning every trace at its peak can help inspect local curve shape, but it hides differences in heating time and should not replace the original comparison.
Ramp and soak: look beyond software labels
Compare ramp rate using the same calculation method. An instantaneous maximum slope and an average slope over a temperature interval are not interchangeable. Sampling noise or a short calculation window can create an apparent ramp-rate excursion that is mainly a data-processing artifact.
Where the paste supplier specifies a soak band, calculate time within that same band for every channel. A longer soak can help reduce temperature differences across a thermally uneven assembly, but may also consume flux activity or extend exposure beyond the recommended profile. Not every paste requires a pronounced soak plateau; forcing one into the benchmark can penalize an otherwise suitable process.
Peak temperature and time above liquidus
Report peak temperature by channel rather than only as an assembly average. The coldest critical joint must receive adequate thermal exposure while the hottest constrained location remains below its applicable limit.
Time above liquidus, or TAL, should use the specified alloy threshold and a consistent crossing rule. If a trace crosses that threshold more than once, disclose whether the software reports cumulative time or a continuous interval. Equal peaks with different TAL values do not represent equivalent soldering conditions.
Consider a heavy connector beside small passive components. Increasing oven temperature may bring the connector joint into range while pushing the smaller parts toward their upper limits. The better profile is the one that satisfies both constraints with usable margin—not necessarily the one with the higher peak.
Temperature spread and cooling
Define temperature spread explicitly. The difference between the highest and lowest channel peaks is not the same as the temperature difference across the board at one instant. Peaks may occur at different times. Both measures can be useful, but they answer different questions.
Also examine when critical joints enter and leave the liquid phase. A narrow spread between peak values can conceal substantially different liquidus-crossing times.
For cooling, specify the temperature interval used to calculate the rate, particularly around solidification where relevant. Faster cooling is not automatically better: solder microstructure, package stress, board construction, and supplier limits all affect the acceptable trade-off. Check the measured board response rather than inferring cooling performance from fan settings.
Benchmark repeatability under realistic loading
One compliant profile demonstrates feasibility, not process stability. Repeat runs under a predefined test plan, with consistent board starting temperature and spacing. Include representative production loading because an isolated board in a stabilized oven does not necessarily represent a sustained production sequence.
Where operationally relevant, assess recovery after an interruption, changes in product spacing, and different conveyor positions. Keep these as identified test conditions rather than mixing them into one unexplained dataset.
Compare the observed range and variation of each critical metric alongside its distance from the nearest limit. A process that passes only narrowly may be less robust than one centered comfortably within the approved window. If the difference between two ovens is comparable to measurement uncertainty, report the ranking as inconclusive.
Capability indices require enough representative data and a stable process. A few profiling passes do not justify a persuasive-looking Cpk value. Nor should readings from different board locations be pooled as though they were repeated measurements of the same characteristic.
Turn the benchmark into an auditable decision
Keep raw time-temperature data, not just a screenshot with green pass indicators. The report should connect each channel to its physical location, applicable limits, calculation method, and result. Include recipe revision, equipment identity, assembly configuration, loading conditions, deviations, and measurement limitations.
A process window index can summarize conformance, but only when its inputs and limits are visible. Different limits, omitted channels, or different calculation settings can change the score without changing the underlying thermal behavior. Use it as a navigation aid, not the entire qualification decision.
This emphasis on traceable, comparable evidence fits SiliconCore Metrics’ independent benchmarking focus across PCB fabrication, SMT assembly, components, and thermal packaging. For cross-supplier evaluations, the useful deliverable is not a league table of peak temperatures; it is a record another engineer can reproduce and challenge.
Finally, connect thermal results to assembly evidence through appropriate inspection and, where required, electrical, cross-sectional, or reliability testing. A compliant profile alone does not prove wetting quality, acceptable voiding, or long-term reliability. If both processes meet every thermal requirement, make the next decision on demonstrated defect performance, repeatability, throughput, and control of change—not on which curve looks smoother.
Recommended News
- Reflow SolderingHow to compare thermal profiles for reflow process benchmarkingImprove reflow process benchmarking by comparing thermal profiles, process windows, and repeatability. Discover how to evaluate ovens and suppliers with reliable, auditable data.
- Reflow SolderingHow thermal cycling reliability testing reveals solder joint fatigueThermal cycling reliability testing reveals solder joint fatigue through CTE mismatch, crack monitoring, and failure analysis—learn how to build more reliable electronics.
- Reflow SolderingHow automotive PCB assembly processes prevent solder joint failuresPCB assembly process automotive controls help prevent solder joint failures through DFM, paste inspection, precise reflow profiling, and risk-based validation. Learn proven reliability practices.
- Reflow SolderingWhat SMT process capability evidence is needed for AEC-Q100 projects?SMT process capability AEC Q100 evidence: learn the essential controls for reflow, MSL, solder-joint inspection, traceability, and automotive release.
- Reflow SolderingWhen does FR4 PCB assembly need tighter reflow temperature control?FR4 PCB assembly needs tighter reflow control when thermal mass, fine-pitch components, moisture, and reliability demands narrow the process window. Learn key profiling factors.
- Reflow SolderingWhat BGA defects reveal weak SMT process capabilitySMT process capability BGA insights: learn how BGA defects expose weak printing, placement, reflow, and inspection control—and what they mean for reliability, audits, and supplier risk.