
Heat Sink Materials Comparison Chart Guide
DETAILS
Heat Sink Materials Comparison Chart Guide
Choosing the right thermal solution starts with understanding material trade-offs.
A practical heat sink materials comparison chart helps teams move faster and avoid costly redesign loops.
That matters more now because thermal margins are shrinking across power electronics, telecom hardware, automotive modules, and dense computing systems.
In real programs, material selection is rarely about conductivity alone.
Weight, cost, corrosion behavior, machinability, finishing options, and sourcing stability all affect the final decision.
This heat sink materials comparison chart guide is designed to support faster selection and clearer trade-off discussions.
It also aligns with the data-first mindset used by SiliconCore Metrics across semiconductor and EMS supply chain benchmarking.
Why material choice drives thermal risk
A heat sink works as a transfer path, not a standalone part.
Its real performance depends on interface resistance, airflow, surface area, geometry, and assembly quality.
Even so, base material still shapes the system envelope.
A poor material fit can increase junction temperature, raise fan demand, and reduce long-term reliability under cyclic loads.
From a sourcing view, the wrong choice can lock a program into unstable pricing or difficult finishing processes.
This is why a heat sink materials comparison chart should be used early, before detailed mechanical release.
Heat sink materials comparison chart at a glance
This heat sink materials comparison chart is a starting point, not a final answer.
The best option depends on heat flux, form factor, assembly method, and operating environment.
Aluminum: the default choice for volume programs
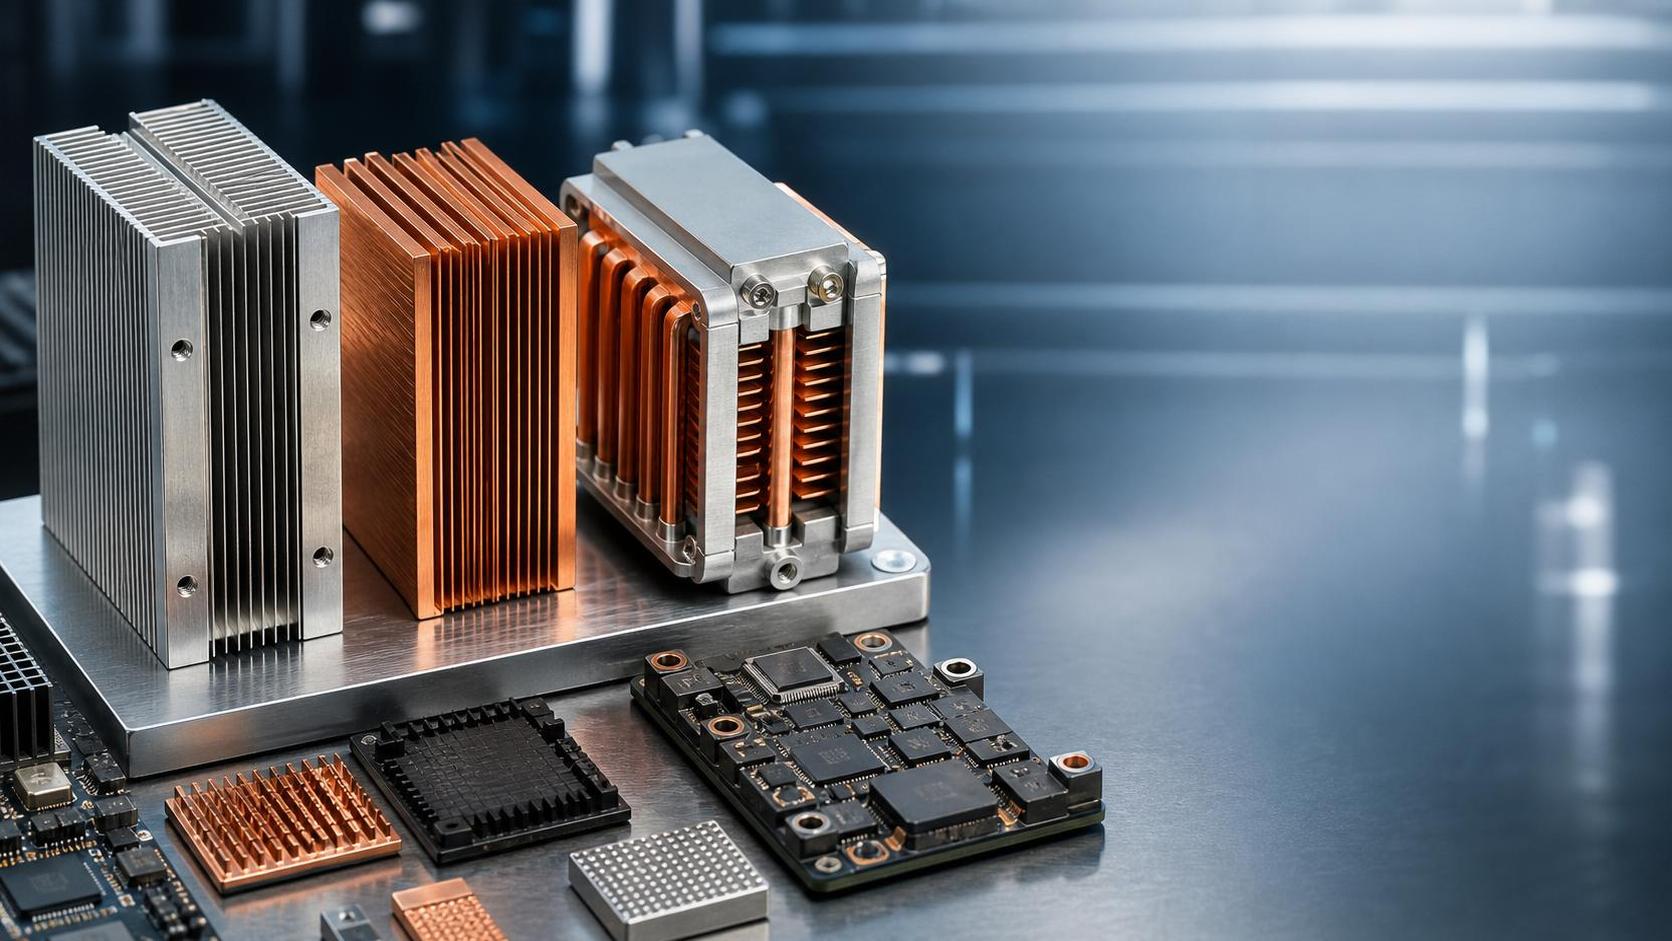
Aluminum remains the most common answer in any heat sink materials comparison chart.
The reason is simple.
It offers a strong mix of thermal performance, low density, extrusion flexibility, and manageable cost.
For many industrial, networking, and consumer applications, that balance is enough.
Aluminum also supports anodizing, which can improve corrosion resistance and surface durability.
Its main limitation appears in tight spaces with concentrated hotspots.
When thermal spreading becomes the bottleneck, aluminum can start to lose ground.
Best fit for aluminum
- Medium power electronics with predictable airflow
- Programs with strong weight constraints
- High-volume builds needing cost control
- Designs based on extruded fin geometry
Copper: high performance with clear trade-offs
Copper usually ranks highest in a heat sink materials comparison chart for raw conductivity.
That makes it attractive for high heat density designs and localized thermal loads.
It can pull heat away from the source faster than aluminum.
Still, the gain comes with extra mass, higher material cost, and more difficult system-level handling.
That added weight can influence shock performance, mounting strategy, and shipping economics.
Copper is often justified when the penalty of overheating is greater than the penalty of cost.
Best fit for copper
- Compact power converters
- RF hardware with concentrated heat zones
- IGBT or MOSFET assemblies
- Programs where performance outranks mass targets
Hybrid and advanced options
A good heat sink materials comparison chart should not stop at aluminum and copper.
Hybrid designs often deliver a better business outcome.
A common example is a copper base with aluminum fins.
This structure improves hotspot spreading while controlling overall mass.
Vapor chambers and graphite spreaders go further in thin or space-limited products.
They are especially useful when heat must move laterally before convection can help.
However, these options demand tighter supplier qualification and stronger reliability validation.
From recent market shifts, this is where more teams are focusing attention.
The clearer signal is that thermal packaging is becoming a sourcing decision, not only a design decision.
How to evaluate the right material for your program
The most useful heat sink materials comparison chart is tied to measurable program constraints.
Start with a short evaluation framework.
- Define maximum junction temperature and thermal resistance target.
- Map heat source distribution, not just total wattage.
- Set clear limits for mass, volume, and mounting load.
- Compare raw material cost with machining, finishing, and assembly cost.
- Check corrosion exposure, vibration profile, and life-cycle stress.
- Review supplier capability, lead time, and compliance history.
This approach keeps the heat sink materials comparison chart connected to actual delivery risk.
It also prevents teams from chasing peak conductivity when the real problem is manufacturability or interface quality.
Common mistakes in heat sink material selection
Several mistakes appear again and again during thermal reviews.
- Using a heat sink materials comparison chart without considering contact resistance
- Selecting copper for performance while ignoring structural load limits
- Choosing aluminum extrusion where geometry really requires skiving or bonding
- Assuming laboratory conductivity numbers translate directly to field performance
- Ignoring finish compatibility, corrosion pairing, or supply chain concentration
In practice, the material is only one layer of the thermal stack.
Better decisions come from comparing system behavior, not isolated datasheet values.
A data-driven way to make the final call
A heat sink materials comparison chart becomes most valuable when paired with independent benchmarking.
That includes thermal test data, dimensional consistency, plating quality, and long-term stress behavior.
This is where organizations like SiliconCore Metrics add practical value.
Independent reporting helps separate supplier claims from repeatable manufacturing performance.
For high-reliability electronics, that extra visibility can shorten approval cycles and reduce sourcing surprises.
The right answer is usually the material that balances thermal headroom, manufacturability, and supply resilience.
Use the heat sink materials comparison chart to narrow the field, then validate with real operating conditions and supplier data.
That final step turns a material choice into a stronger engineering decision and a more reliable program outcome.
Recommended News
- Heat DissipationHow to prevent overheating in automotive PCB power distributionPrevent overheating in automotive PCB power distribution with practical tips on copper layout, thermal paths, and testing. Discover how to reduce hotspots and improve reliability.
- Heat DissipationCan heat spreading intelligence identify hot spots in PCB designs?Discover how heat spreading intelligence identifies PCB hot spots before fabrication. Learn to assess thermal models, validate predictions, and choose design changes that improve reliability.
- Heat DissipationWhich heat sink materials suit high-power electronics made in Germany?Heat sink materials Germany: compare aluminum, copper, graphite, and hybrid designs for high-power electronics. Find the right balance of thermal performance, weight, cost, and manufacturability.
- Heat DissipationHow to assess a graphite materials supplier's capability for thermal partsGraphite materials supplier assessment starts with more than machining. Discover how to evaluate thermal performance, purity, precision, cleanliness, traceability, and testing for reliable thermal parts.
- Heat DissipationHow to assess a heat dissipation supplier before placing an orderHeat dissipation supplier assessment guide: verify thermal performance, materials, process control, samples, capacity, and total risk before placing an order.
- Heat DissipationHow automotive PCB material selection affects thermal reliabilityAutomotive PCB material selection shapes thermal reliability. Explore CTE, Tg, moisture resistance, stack-up design, and proven qualification strategies for demanding vehicle electronics.