
Which semiconductor quality metrics best predict field reliability?
DETAILS
A low outgoing defect rate does not, by itself, predict low field failure. Semiconductor devices can pass final electrical test with excellent yield and still fail prematurely when exposed to temperature cycling, bias stress, moisture, vibration, high current density, or rare application states that production tests do not reproduce. The most useful semiconductor quality metrics are therefore those that connect manufacturing variation, electrical margin, package integrity, and stress-test behavior to the device’s actual mission profile.
The practical objective is not to collect the largest possible set of supplier figures. It is to identify whether a device population has sufficient margin against the dominant failure mechanisms in the finished product. For a power MOSFET in a switching converter, that may mean bond-wire fatigue, solder-joint stress, avalanche robustness, and threshold-voltage drift. For a memory device, retention, cycling endurance, and data-integrity behavior under voltage and temperature extremes may matter more. A single universal “reliability score” is not technically meaningful.
Field reliability begins with a defined failure model
Quality metrics become predictive only when they are interpreted against the use environment. The same component may be adequate in an indoor consumer product and unsuitable for equipment subject to frequent thermal cycling, elevated humidity, continuous duty, or safety-critical operation.
A meaningful reliability review starts by defining the stresses the device will actually experience:
- junction temperature range and time at elevated temperature;
- ambient temperature cycling rate, dwell time, and number of cycles;
- voltage derating, transient exposure, and repetitive switching conditions;
- current loading, surge events, and power cycling;
- humidity, corrosive gases, condensation risk, and contamination exposure;
- mechanical shock, vibration, board flexure, and connector-induced stress;
- required service life, acceptable failure consequence, and repairability.
Without this context, a reported failure-rate figure can be misleading. For example, a reliability result at a fixed high-temperature operating life condition may support comparison among similar devices and test plans, but it does not automatically demonstrate endurance under rapid power cycling or repeated cold-to-hot field exposure. The relevant metric is the one that exercises the likely failure mechanism.
Defect density is necessary, but it is a weak standalone predictor
Defect density, often reported as defects per million opportunities, DPPM, or parts per million defective, is useful because it measures observed nonconformance at a particular inspection or test gate. It can reveal whether a supplier’s outgoing quality is stable, whether a lot has deteriorated relative to historical performance, and whether a specific defect mode is recurring.
Its limitation is equally important: DPPM measures detected defects under defined conditions. It does not capture latent defects that remain electrically acceptable until later stress. A low final-test DPPM may coexist with marginal die attach, weak interconnect metallurgy, moisture-sensitive packaging, or process variation that only becomes visible after aging.
For field-reliability assessment, defect data should be separated rather than accepted as a single aggregate number. The following distinctions matter:
- Test escape versus process defect: A test escape indicates inadequate detection coverage; a process defect may indicate instability in wafer fabrication, assembly, or handling.
- Electrical versus mechanical or package-related defect: Electrical parametric failures and package cracks do not carry the same field-risk implications.
- Random versus systematic recurrence: A repeated failure signature across lots, date codes, or assembly sites requires a different response from isolated random defects.
- Lot-level versus rolling performance: A long-term average can hide a recent process shift. Lot-to-lot variation is often more informative than an overall annual value.
Defect Pareto data, corrective-action records, and lot traceability provide more decision value than a headline DPPM claim. The key question is whether the defect modes align with known field failure mechanisms and whether containment and root-cause actions can be verified across subsequent lots.
Parametric distribution and drift reveal shrinking design margin
Devices rarely fail in the field because a nominal data-sheet value was incorrect. Failures occur because a parameter moves beyond the system’s usable boundary after manufacturing variation, aging, or environmental stress. This makes parametric distribution data one of the strongest semiconductor quality metrics for anticipating field performance.
Average values are insufficient. A reported mean threshold voltage, on-resistance, leakage current, propagation delay, reference-voltage accuracy, or gain can appear comfortably within specification while a tail of the distribution approaches a functional limit. Reliability risk rises when a design relies on typical values rather than guaranteed limits, particularly where temperature and aging move the parameter in the same unfavorable direction.
Useful evidence includes distribution width, specification guard bands, lot-to-lot shifts, correlation among parameters, and pre-stress versus post-stress measurements. Statistical process control indicators such as Cp and Cpk can help assess whether a process is capable relative to its specification limits, but they must be interpreted carefully. A high Cpk against a broad internal electrical limit does not prove that the device retains enough margin in a narrower system-level application window.
Drift under stress is often more informative than initial conformance. Relevant examples include:
- threshold-voltage shift in MOS devices under bias and temperature;
- leakage-current growth after high-temperature or humidity exposure;
- on-resistance movement in power devices;
- timing or oscillator-frequency drift in precision and mixed-signal circuits;
- reference and offset drift in analog devices;
- retention, endurance, or error-rate change in memory products.
A sound review asks whether post-stress measurements remain within data-sheet limits, but also whether the remaining margin is adequate for the end equipment. Passing a qualification criterion is not identical to preserving system margin.
Accelerated life-test results are valuable only when the stress is relevant
High-temperature operating life (HTOL), high-temperature storage life (HTSL), temperature cycling, temperature-humidity-bias testing, autoclave or highly accelerated stress testing, and electrostatic discharge qualification are widely used to assess device robustness. Many of these methods are defined within the JEDEC JESD22 series. JESD47 provides a widely recognized framework for stress-test-driven qualification of integrated circuits, while application-specific requirements may impose additional conditions. Automotive integrated circuits, for example, are commonly assessed against AEC-Q100 requirements; qualification scope should always be checked at the specific device level.
These tests are essential evidence, but the interpretation should go beyond “passed” or “qualified.” The most relevant details are the test method, sample size, stress duration, temperature, applied bias, readout criteria, observed failures, and failure analysis results. A qualification report with no reported failures is stronger when its conditions are well documented and when its test vehicles, package, die revision, and assembly flow match the supplied product.
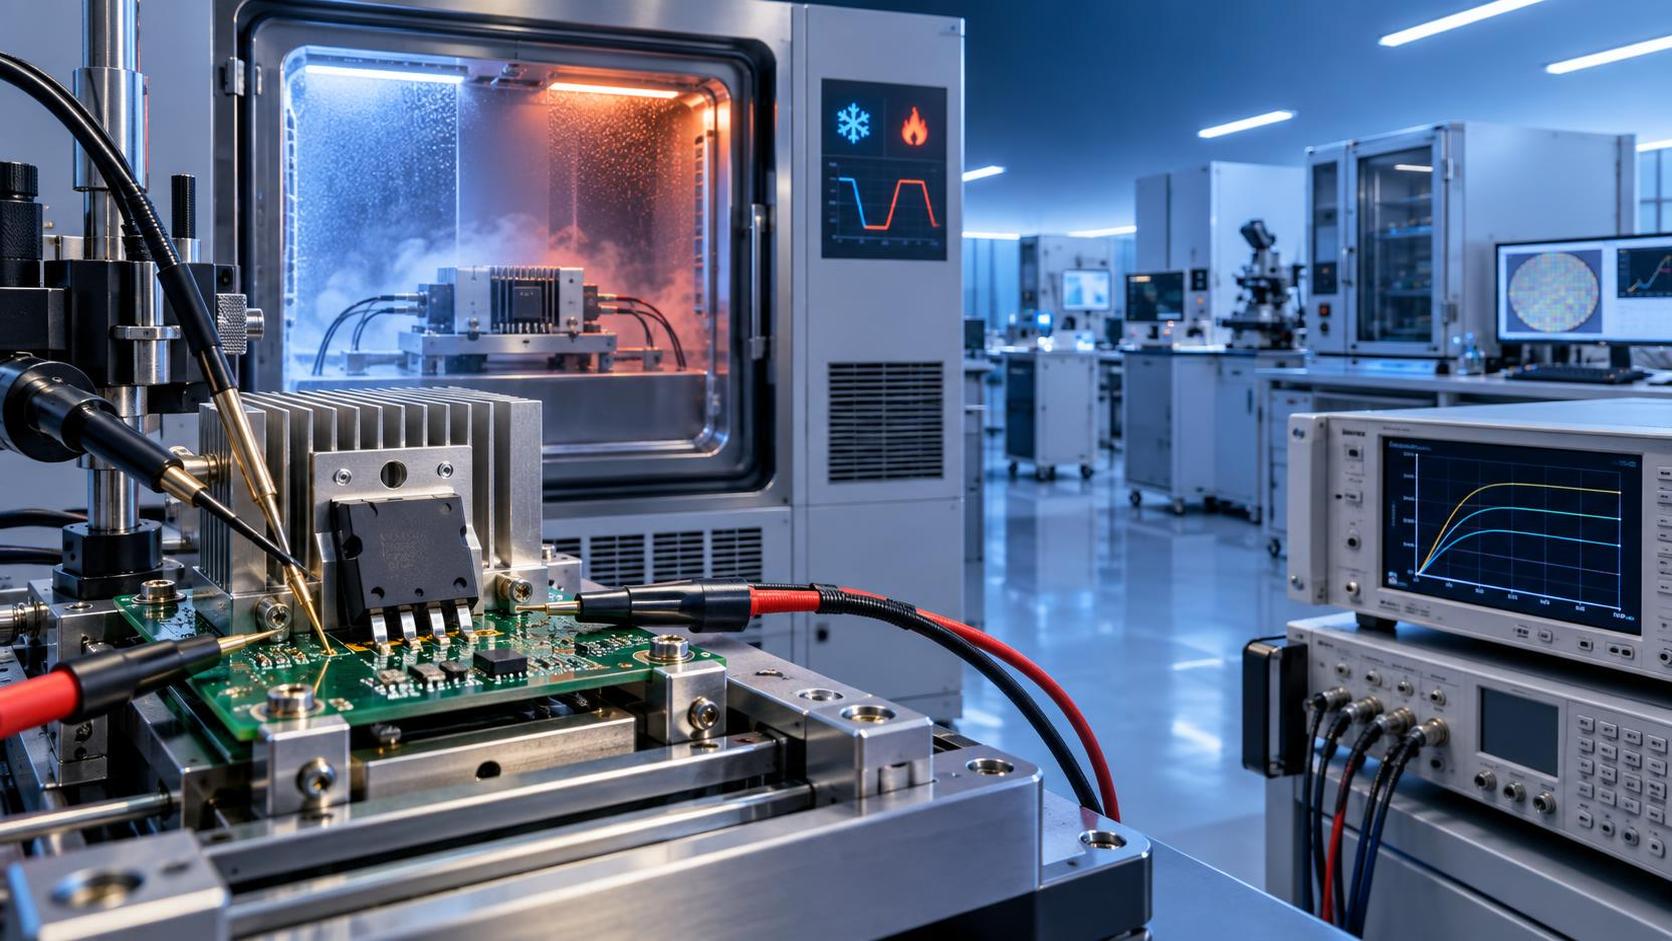
HTOL is particularly useful for identifying time-dependent electrical degradation mechanisms under elevated temperature and bias. Yet HTOL may not expose solder fatigue, board-level cracking, package warpage, or the damage caused by frequent power on/off cycles. Temperature cycling is more relevant to mismatches in coefficient of thermal expansion among die, mold compound, lead frame, balls, substrate, and printed circuit board. Power cycling can be more representative for devices whose junction temperature swings substantially during normal operation.
Humidity-related tests need equally careful interpretation. Moisture sensitivity classification governs handling risk during assembly and reflow; it should not be treated as proof of long-term operational humidity robustness. Moisture Sensitivity Level classification is associated with JEDEC J-STD-020, while component handling and dry-pack practices are addressed by J-STD-033. Long-term operation in humid or corrosive environments may require evidence from biased humidity tests and, where applicable, corrosion-focused evaluation.
Failure-rate figures require confidence bounds and use-condition discipline
Failure rates may be expressed as FIT, meaning failures in 109 device-hours, or as an estimated rate derived from accelerated testing and a selected acceleration model. Such figures can assist with allocation and comparative risk analysis, but they are frequently overinterpreted.
A stated FIT value depends on the assumed failure distribution, stress condition, acceleration factor, confidence level, and failure mechanism. Temperature acceleration is often modeled using an Arrhenius relationship, but the assumed activation energy must be appropriate for the degradation mechanism being considered. Applying one activation energy indiscriminately to all mechanisms produces a precise-looking number with uncertain relevance.
Zero observed failures do not mean zero field failures. They establish a statistical upper bound that depends on accumulated device-hours and confidence level. Reliability claims should therefore identify the confidence basis, not merely state a single calculated rate. When comparing suppliers, results are only comparable if test conditions, sample populations, duration, failure criteria, and statistical treatment are aligned.
For systems requiring dependable operation over a defined life, an engineering reliability model should combine the component evidence with the actual duty cycle: junction temperature, thermal excursion amplitude, operating hours, electrical loading, and environmental exposure. A generic FIT figure cannot replace that exercise.
Package and assembly indicators often determine the field outcome
In many applications, the active silicon is not the dominant field-risk source. Package interconnects, die attach, wire bonds, copper clips, mold compounds, solder balls, and external board solder joints can govern long-term reliability. This is especially true for large packages, high-power devices, fine-pitch ball-grid arrays, and assemblies exposed to repeated temperature excursions.
Several indicators deserve close attention:
- Preconditioning before package stress: Preconditioning that includes moisture exposure and reflow simulation helps determine whether subsequent stress testing represents the delivered component’s assembly exposure.
- Acoustic microscopy and cross-section results: These can reveal delamination, voiding, cracks, or die-attach anomalies that electrical tests may not detect immediately.
- Wire-bond and die-shear data: These are process-health indicators, particularly where high current, high temperature, or mechanical stress may challenge interconnect integrity.
- Board-level reliability evidence: Component-level qualification does not prove board-level solder-joint endurance. Board material, pad design, assembly profile, underfill use, and mechanical constraints all affect the result.
- Lot and assembly-site traceability: Changes in mold compound, lead frame, bump process, assembly location, or substrate can affect reliability even if the ordering code remains unchanged.
For power semiconductors, thermal resistance values must also be treated as conditions-dependent design inputs rather than permanent device properties. Junction-to-case and junction-to-ambient figures depend on the defined measurement setup; real thermal performance is governed by mounting, interface material, copper area, airflow, enclosure design, and transient load profile. Elevated junction temperature accelerates multiple wear-out mechanisms, so thermal margin is a reliability metric at system level even when the component itself meets specification.
Screening coverage matters when the consequence of failure is high
Qualification establishes that a device design and manufacturing flow have been assessed under prescribed stresses. Production screening determines how effectively individual defects are removed from shipped units. These are related but distinct controls.
Electrical test coverage, burn-in where required, stress screening, x-ray or acoustic inspection for selected package risks, and lot acceptance procedures can reduce escape risk. Their value depends on the defect mechanism. Burn-in can identify some early-life weaknesses, but it may provide little protection against wear-out mechanisms driven by thermal-mechanical cycling. More screening is not automatically better if it adds stress without addressing the relevant risk.
The strongest screening plans are targeted. They link known failure mechanisms to measurable indicators, define action limits, preserve traceability, and trigger formal disposition when a process excursion occurs. A broad statement that every unit is “100% tested” has limited meaning unless the test conditions, parameter coverage, guard bands, and retest policy are known.
A practical hierarchy for reliability evidence
When time and data availability are limited, the most predictive evidence generally comes from convergence across several layers rather than excellence in one metric:
The most defensible conclusion is reached when these data tell a consistent story: stable distributions before stress, acceptable drift afterward, qualification targeted to realistic mechanisms, controlled package processes, and no unresolved recurring defect signature.
What should trigger deeper investigation
Several patterns warrant scrutiny even when a component is nominally qualified: an unexplained change in assembly site or material set; widening parametric distributions; a sudden rise in leakage-related rejects; increasing retest rates; qualification reports based on a different package or die revision; failure-rate claims without stated assumptions; or a mismatch between the stress tests performed and the equipment’s actual environment.
Field reliability is best predicted by evidence of margin, not by compliance labels alone. Semiconductor quality metrics become decision-grade when they show how a specific device population behaves before and after relevant stress, how manufacturing variation is controlled, and whether the remaining electrical and mechanical margin is sufficient for the product’s required life. That distinction separates a part that merely passes release testing from one supported by credible reliability evidence.
Recommended News
- Power SemiHow to reduce lead-time risk in 24V component sourcing24V component sourcing made resilient: learn how to qualify alternates, verify lead times, control quality risk, and keep production moving.
- Power SemiWhich semiconductor quality metrics best predict field reliability?Semiconductor quality metrics that best predict field reliability: evaluate parametric drift, stress-test relevance, package integrity, screening coverage, and true mission-profile margin.
- Power SemiWhat Is the Biggest Risk of Skipping Power Electronics Supplier Audits?What is the biggest risk when skipping supplier audits for power electronics? Hidden reliability failures, weak traceability, and costly field failures. Learn how audits protect quality.
- Power SemiHow to qualify semiconductor power devices for reliable switching performanceSemiconductor quality power devices: learn how to qualify switching margins, thermal reliability, gate-drive behavior, and production consistency for demanding converters.
- Power SemiHow to Evaluate Energy Saving Semiconductor Solutions for High-Efficiency Power DesignEnergy saving semiconductor solutions for high-efficiency power design: learn how to compare loss, thermal, EMI, reliability, and supply chain factors to choose the right device.
- Power SemiHow to Evaluate a Power Semiconductors Distributor for Supply Stability and TraceabilityPower semiconductors distributor evaluation guide: learn how to verify supply stability, traceability, sourcing controls, and documentation to reduce risk and choose a reliable partner.